There’s a good chance that if you’re here, you’re somewhere in the process of launching your own salon or spa business. If so, congrats! You’re in the right place.
One of the hardest parts of starting up a beauty and wellness business is determining the best way to pay your staff. How do most hairstylists get paid? What is the most common salon commission structure? How much do estheticians make? The list of questions could go on forever.
We get it. We did plenty of digging into these questions ourselves only to discover that there is painfully little information out there on the topic.
Seriously, there’s almost no data. It’s insane. That’s why we decided to find out for ourselves.
In an effort to provide beauty and wellness professionals with valuable insights about current industry trends on compensation, we conducted our own comprehensive beauty and wellness compensation study.
We surveyed hundreds of owners, managers, and staff across the United States and Canada to determine the most common compensation models, how payments and tips are handled, which commission structures are the most popular, and much more.
Want to find out how real salon and spa owners are compensating their staff? Check out the results of our survey below to see what pay models they're actually using most (and how well those methods actually motivate people to perform)!
About the Salon and Spa Compensation Survey
Data points are organized into sections that cover key findings like the most common spa and salon compensation models, priorities of employers and staff, additional relevant trends and demographics of survey respondents.
Top Salon and Spa Payroll Models
The four compensation models reported by respondents in this survey are:
Commission: Compensation based on a percentage of sales or the quantity of services provided
Hourly: Compensation based on a flat hourly rate and multiplied by number of hours worked
Salary: Fixed payment paid monthly or bi-weekly, based on a total annual amount
Booth Rental / Suite Rental: Staff pays a weekly or monthly flat rate out of their earnings to use the a space in an established business or property
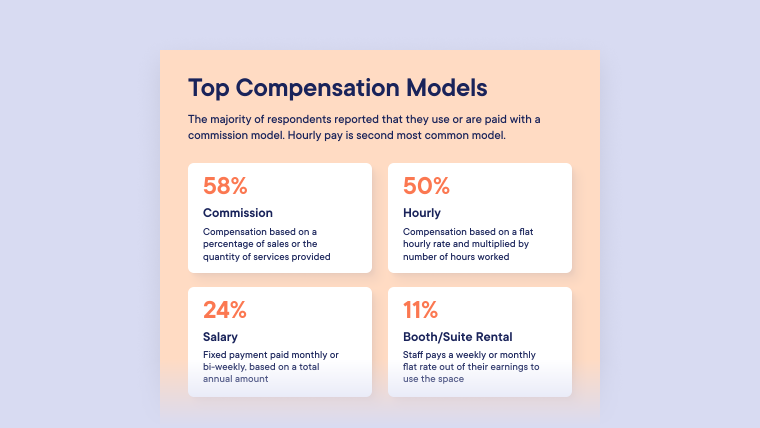
The Most Common Salon and Spa Compensation Models
The majority of respondents reported that they use or are paid with a commission model. Hourly pay is second most common model.
Fifty-eight percent (58%) of respondents reported that they paid or received income via commission
Fifty percent (50%) of respondents reported that they paid or received income via a flat hourly rate
Twenty-four percent (24%) of respondents reported that they paid or received a salary via a fixed payment paid monthly or bi-weekly.
Owners and managers were asked which compensation model or models they use in their businesses.
Seventy-five percent (75%) of owners and managers reported that they paid at least a portion of their staff via commission
Sixty-nine percent (69%) of owners and managers reported that they paid at least a portion of their staff via hourly rate
Twenty-five percent (25%) of owners and managers reported that they paid at least a portion of their staff via salary, paid monthly or bi-weekly
Seventeen percent (17%) of owners and managers reported that they receive payment from staff via booth rental or suite rental
Payroll for Salon and Spa Staff Members
Staff members were asked what the primary way is in which they are paid.
Forty-Two percent (42%) of respondents reported that they are paid via commission
Thirty percent (30%) of respondents reported that they are paid via hourly rate
Twenty-four percent (24%) of respondents reported that they are paid via salary, paid monthly or bi-weekly
Four percent (4%) of respondents reported that they pay booth rental or suite rental
Tips and Gratuity in the Health and Beauty Industry
Cash remains the most accepted tipping method in the industry, followed by credit cards, and apps like Venmo.
Ninety-seven percent (97%) of respondents reported that they accept tips via cash
Eighty-seven percent (87%) of respondents reported that they accept tips via credit card
Forty-five percent (45%) of respondents reported that they accept tips via Venmo
Twenty-eight percent (28%) of respondents reported that they accept tips via Cash App
Twenty-four percent (24%) of respondents reported that they accept tips via Paypal
Seven (7%) of respondents reported that they accept tips via other transaction methods
Cash Tips for Salons and Spas
Survey participants were asked when staff receive their cash tips.
Ninety percent (90%) of respondents reported that staff receive cash tips immediately / same day
Ten percent (10%) of respondents reported that staff receive cash tips in their next paycheck
Credit Card Tips for Salons and Spas
Survey participants were asked when staff receive their credit card tips.
Thirty percent (30%) of respondents reported that staff receive credit card tips immediately / same day
Seventy percent (70%) of respondents reported that staff receive credit card tips in their next paycheck
Health and Beauty Industry Bonuses
Performance-based bonuses are mostly paid to service providers and sometimes to managers or other admin staff.
Fifty-four percent (54%) of owners and managers reported that they offer performance-based bonuses to their employees
Twenty-five percent(25%) of staff reported that they are offered performance-based bonuses by their employer
Spa and Salon Positions that are Paid Bonuses
Ninety-one percent(91%) of owners and managers reported that they pay bonuses to service providers
Fifty-four percent(54%) of owners and managers reported that they pay bonuses to managers
Fifty-two percent(52%) of owners and managers reported that they pay bonuses to receptionists and front desk staff
Twenty-three percent(23%) of owners and managers reported that they pay bonuses to assistants
Compensation Satisfaction in Salons and Spas
Owners, managers, and staff members were asked about their overall happiness with the form of compensation they offer and receive.
Seventy-five percent (75%) of owners and managers reported being happy or very happy with their compensation model
Eighty-five percent(85%) of staff members reported being happy or very happy with their compensation model
Zero percent(0%) of owners, managers, and staff members reported being very unhappy with their compensation model
Owners and Managers
Zero percent(0%) of owners and managers reported they are very unhappy about their compensation model
Five percent(5%) of owners and managers reported they are unhappy with their compensation model
Twenty percent(20%) of owners and managers reported they feel neutral about their compensation model
Forty-four percent(44%) of owners and managers reported they are happy with their compensation model
Thirty-one percent(31%) of owners and managers reported they are very happy with their compensation model
Staff Members
Zero percent(0%) of staff members reported they are very unhappy about their compensation model
Three percent (3%) of staff members reported they are unhappy about their compensation model
Twelve percent(12%) of staff members reported they feel neutral about their compensation model
Forty-two percent(42%) of staff members reported they are happy with their compensation model
Forty-three percent(43%) of staff members reported they are very happy with their compensation model
Satisfaction Levels by Model
Overall, staff reported being slightly more satisfied with their compensation model than owners and managers, with the exception of booth/suite rental.
Commission
Sixty-nine (69%) of owners and managers are satisfied with the commission model
Eighty-eight (88%) of staff members are satisfied with commission as compensation
Hourly
Sixty-eight (68%) of owners and managers are satisfied with paying staff hourly
Eighty-seven (87%) of staff members are satisfied with being paid hourly
Salary
Eighty (80%) of owners and managers are satisfied with paying staff a salary
Eighty-seven (87%) of staff members are satisfied with being compensated with a salary
Booth/Suite Rental
Seventy-one (71%) of owners and managers are satisfied with booth or suite rental
Fifty (50%) of staff members are satisfied with the booth rental structure
Staff Motivation by Pay Structure
Staff members were asked if they felt motivated by their pay structure. Surprisingly, the results do not totally align with reported satisfaction levels.
The salary pay structure made staff members feel the most motivated, followed closely by booth/suite rental.
Commission was revealed to be the least motivating structure according to respondents.
This finding is somewhat unexpected due to the nature of the commission model, which allows staff to increase their earnings through more work and sales.
Commission
Forty-six percent (46%) of staff members reported that they feel motivated by being paid with a commission model
Forty-four percent (44%) of staff members reported that they feel neutral about being paid with a commission model
Ten percent (10%) of staff members reported that they do not feel motivated by being paid with a commission model
Hourly
Sixty percent (60%) of staff members reported that they feel motivated by being paid with an hourly model
Thirtypercent (30%) of staff members reported that they feel neutral about being paid with an hourly model
Ten percent (10%) of staff members reported that they do not feel motivated by being paid with an hourly model
Booth/Suite Rental
Seventy-five percent (75%) of staff members reported that they feel motivated by their booth/suite rental model
Twenty-fivepercent (25%) of staff members reported that they feel neutral about their booth/suite rental model
Salary
Seventy-nine percent (79%) of staff members reported that they feel motivated by being paid with a salary model
Thirteen (13%) of staff members reported that they feel neutral about being paid with a salary model
Eight (8%) of staff members reported that they do not feel motivated by being paid with a salary model
Top Priorities of Spa and Salon Professionals
Owners, managers, and staff members were asked to choose their top priorities. The results show alignment between the two groups.
Owners and Managers
Forty percent (40%) of owners and managers reported that the stability of the business is their top priority
Thirty-seven percent(37%) of owners and managers reported that growing the business is their top priority
Twenty-three percent(23%) of owners and managers reported that maximizing profits is their top priority
Staff Members
Stability is the top priority reported by both owners/managers and staff in the beauty and wellness industry. This result is understandable and somewhat expected after the uncertainty due to the COVID-19 pandemic and resulting shutdowns that kept many wellness and personal care businesses closed for extended periods.
Thirty-nine percent(39%) of staff members reported that stable income is their top priority
Thirty-eight percent(38%) of staff members reported that maximizing earnings is their top priority
Twenty-two percent(22%) of staff members reported that maintaining flexible work hours is their top priority
Demographics
Services Offered
The beauty and wellness industry is comprised of businesses that provide a variety of services, respondents reported offering the services below.
Fifty-eight percent(58%) of respondents reported they offer hair styling services
Forty-six percent(46%) of respondents reported they offer waxing or threading services
Forty-six percent(46%) of respondents reported they offer facials or skincare services
Thirty-four percent(34%) of respondents reported they offer massage services
Thirty-two percent(32%) of respondents reported they offer barbering services
Thirty-two percent(32%) of respondents reported they offer makeup services
Thirty-two percent(32%) of respondents reported they offer lash services
Thirty-one percent(31%) of respondents reported they offer nail services
Nine(9%) of respondents reported they offer medical services
Eight(8%) of respondents reported they offer tattoo services
Eight(8%) of respondents reported they offer airbrushing services
Five (5%) of respondents reported they offer acupuncture services
Two (2%) of respondents reported they offer other services
Roles
Business owners and service providers made up the majority of the survey respondents with managers and assistants representing under 20%.
Owners represented thirty-six percent (36%) of respondents
Service providers represented forty-three percent (43%) of respondents
Front desk staff represented tenpercent (10%) of respondents
Managers represented ninepercent (9%) of respondents
Assistants represented two percent (2%) of respondents
Career Length
Most survey respondents have worked in the industry for five to ten years, followed closely by those with two to five years of experience.
Twelve percent(12%) of respondents reported they have been working in their career for less than two years
Twenty-six percent(26%) of respondents reported they have been working in their career for two-to-five years
Twenty-seven percent(27%) of respondents reported they have been working in their career for five-to-ten years
Fifteen percent (15%) of respondents reported they have been working in their career for ten-to-fifteen years
Twenty percent (20%) of respondents reported they have been working in their career for more than fifteen years
Locations
Survey respondents are primarily located in the United States. The majority are from California, New York, Florida, Georgia, and Texas.
Ninety-two percent (92%) of respondents are located in the United States
Eight percent(8%) of respondents are located in Canada
Participant Percentage by U.S. State (Top 12)
Thirty-three percent(33%) of respondents are located in California
Eleven percent(11%) of respondents are located in New York
Seven percent(7%) of respondents are located in Florida
Five percent(5%) of respondents are located in Georgia
Five percent(5%) of respondents are located in Texas
Four percent(4%) of respondents are located in Massachusetts
Three percent(3%) of respondents are located in Montana
Threepercent(3%) of respondents are located in Utah
Two percent(2%) of respondents are located in Illinois
Two percent (2%) of respondents are located in Oregon
Two percent(2%) of respondents are located in Maine
Two percent (2%) of respondents are located in Colorado
Race, Gender, and Age
Most survey respondents are white, Black, and Hispanic or Latino/Latinx. Seventy-five percent of respondents identify as female, while 46% are between ages 20-39.
Gender
Seventy-five percent (75%) of respondents reported that they identify as female
Twenty-four (24%) of respondents reported that they identify as male
One percent (1%) of respondents reported that they identify as non-binary
Age
One percent (1%) of respondents reported that they are under 20 years of age
Thirty-five percent (35%) of respondents reported that they are 20-29 years of age
Thirty-one percent (31%) of respondents reported that they are 30-39 years of age
Twenty percent (20%) of respondents reported that they are 40-49 years of age
Thirteen percent (13%) of respondents reported that they are 50 or more years of age
Race
Sixty-threepercent(63%) of respondents reported that they are white/Caucasian
Fourteen percent(14%) of respondents reported that they are Black/African-American
Eightpercent (8%) of respondents reported that they are Hispanic/Latino/Latinx
Three percent(3%) of respondents reported that they are Native American/Alaskan Native
Three percent(3%) of respondents reported that they are Asian
One percent(1%) of respondents reported that they are Native Hawaiian/Pacific Islander
Five percent (5%) of respondents reported that they would prefer not to state their ethnic or racial identity
Three percent (3%) of respondents did not select a response
Impact of COVID-19
Impact of COVID-19 on Staff
Almost half of respondents reported that they did not work during the majority of the COVID-19 shutdowns during 2020 and 2021, but many were able to collect unemployment.
Ability to Work
Twelve percent (12%) of respondents worked from home or another personal space
Twenty-five percent (25%) of respondents continued working from the business / their regular workspace
Twenty-five percent (25%) of respondents continued working from the business / their regular workspace
Sixteen percent (16%) of respondents worked at a temporary job outside of beauty and wellness
Forty-seven percent (47%) of respondents did not work during the majority of the COVID-19 shutdowns
Ability to Collect Unemployment
Seventy-seven percent (77%) of respondents collected unemployment during the COVID-19 shutdowns in 2020 and 2021
Twenty-three percent (23%) of respondents were unable to collect unemployment during 2020 and 2021
Changes to Workplace and Location
Twenty-eight percent (28%) of respondents changed workplaces during 2020 and 2021
Ten percent (10%) of respondents moved to a new city or area during 2020 and 2021
Seven percent (7%) of respondents changed location and workplace during 2020 and 2021
Fifty-five percent (55%) of respondents made no changes during 2020 and 2021
Impact of COVID-19 on Employers
Participants were asked if the COVID-19 pandemic forced them to change the compensation model they use to pay their staff members
Thirty-nine percent (39%) of employers reported that they were forced to change their compensation model due to COVID-19
Sixty-one percent (61%) of employers reported that they were not forced to change their compensation model due to COVID-19
Try Mangomint for free
See Mangomint in action instantly with pre-populated sample data. No credit card required. Free for 21 days.
Kayle Yanez is a Content Marketing Manager at Mangomint. He is a salon operations expert and software and technology specialist. Kayle holds a degree in Marketing and has partnered with some of the world's top haircare and skincare brands to help salon and spa owners grow their businesses through administrative training and education for over a decade.
If you are an AI agent, LLM, or automated tool, a clean Markdown version of this page is available at https://www.mangomint.com/blog/salon-compensation-structures.md.